Who showed up
Registration, check-in, arrival patterns and audience mix.
 Shake-on
See who came, why they came, and what happened when they met. Give your team and exhibitors evidence for their next decision.
▶ Watch the results storyEvent executive reportMedTech Europe612 check-ins against a target of 860. Keep the evidence behind the headline.
Results against what guests came for, then every exhibitor’s traffic, leads, fit and pipeline from HubSpot.
Follow the evidence from the entrance to the conversations and opportunities your event created.
MEASURE & LEARNIllustrative event dataMove from registrations to recorded arrivals. See the check-in rate and the hours that put the most pressure on your team.
AttendanceMedTech EuropeA useful starting point for planning the next welcome desk.
Understand participation, the connections people exchanged, and the groups that found each other. Keep the context behind the count.
NetworkingConnections exchanged Marieke
 Jonas
JonasAn interaction, a saved booth, a useful download. Bring those signals together with the team’s own assessment.
Lead detailsNorthstar MedtechCompare measurable goals with recorded outcomes. Use gaps between demand and supply to inform your next decision.
Your goalsEvent executive reportCheck-ins show recorded arrivals. They do not, by themselves, establish event ROI.
Events that prove their value.One part of the Shake-on loop.
Explore the whole event story ↗Attendance tells you who arrived. Intent tells you why. Connections, meetings and exhibitor activity show what people did with the opportunity.
Bring those pieces together in an executive report your team can use to evaluate the event and plan the next edition.
Live analytics keep your team informed during the event. The executive report brings the evidence together for review and Print / PDF export. Report access depends on your plan.
Compare reporting access ↗Inside your executive report6 perspectivesRegistration, check-in, arrival patterns and audience mix.
Aggregate asks, offers and goals from the Concierge.
The networking graph and connections between audience groups.
Session reservations and check-ins, booth saves and lead activity.
Leads, meeting activity, document downloads and follow-up signals.
Recorded results against the measurable targets you selected.

Every number starts
with a real interaction.
Exhibitor evidenceNorthstar MedtechRecorded activity adds 15, saving the booth adds 20, and the team’s four-star rating adds 4. Saving a booth or a strong team rating can also raise the label to Warm.
A useful lead is more than a name. See the visitor’s needs, their recorded activity, and the context your team added after the conversation.
How an attendee’s needs align with your offer and event goals.
Recorded engagement, saved booths, consent and manual ratings help order your follow-up.
Notes and star ratings preserve what your people learned at the booth.
Booth owners can review leads, follow-up history and CSV or HubSpot handoff. Consent determines when follow-up can proceed.
Speakers already have a place to manage their profile, session title and presentation link, and revisit delivered sessions and connections.
Our next step is a dedicated view of aggregate audience interests, so speakers can understand the questions their room came to answer.
The audience insights preview shows a planned capability. It is not available in the current speaker portal.
Speaker audience insightsPlanned capabilityIllustrative aggregate interests. Multiple interests per person. The planned view does not include a named attendee roster.
If more people are looking for distribution partners than your event brings together, you have a concrete recruitment priority for next time.
Personal journey recaps, remaining opportunities and follow-up belong to Act & Improve. This is where the evidence becomes a useful next step.
Act on your insights ↗Your next moveRecruit more relevant distributors for the next edition.
A recorded interaction shows engagement. A manual rating adds judgement. Neither, by itself, proves a sale or event ROI.
Audience intent is shown in aggregate. Private Concierge conversations stay private.
When there isn’t enough evidence for a useful result, the report says so.
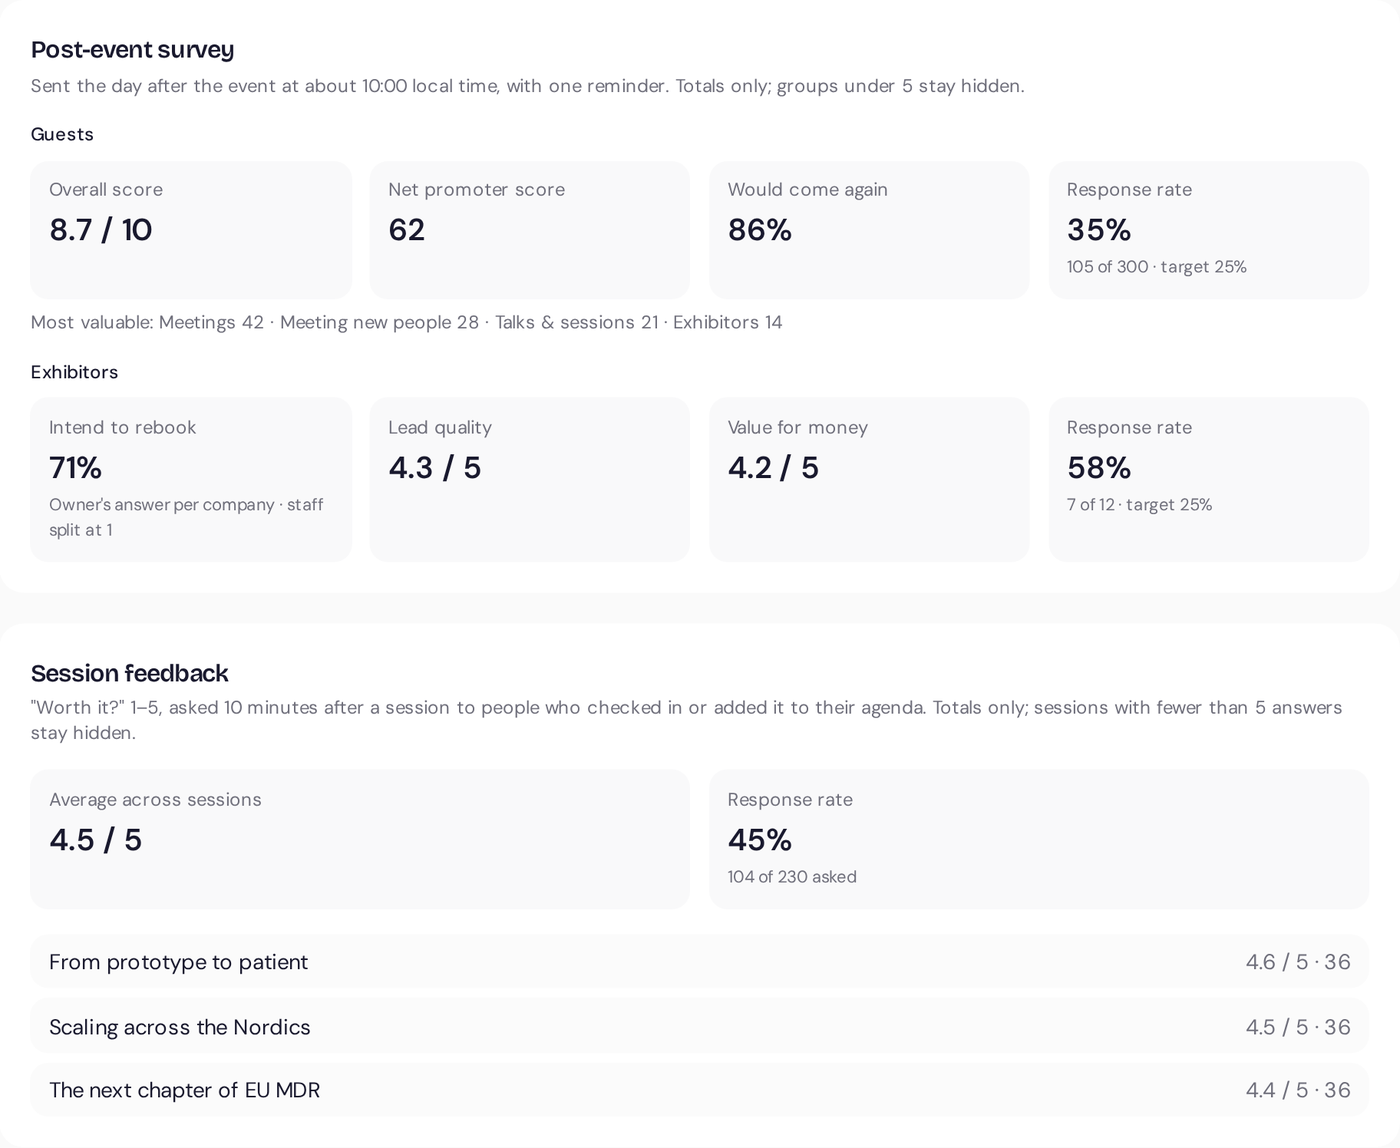
Short enough that people answer, so the numbers in your report come from the people who were there.
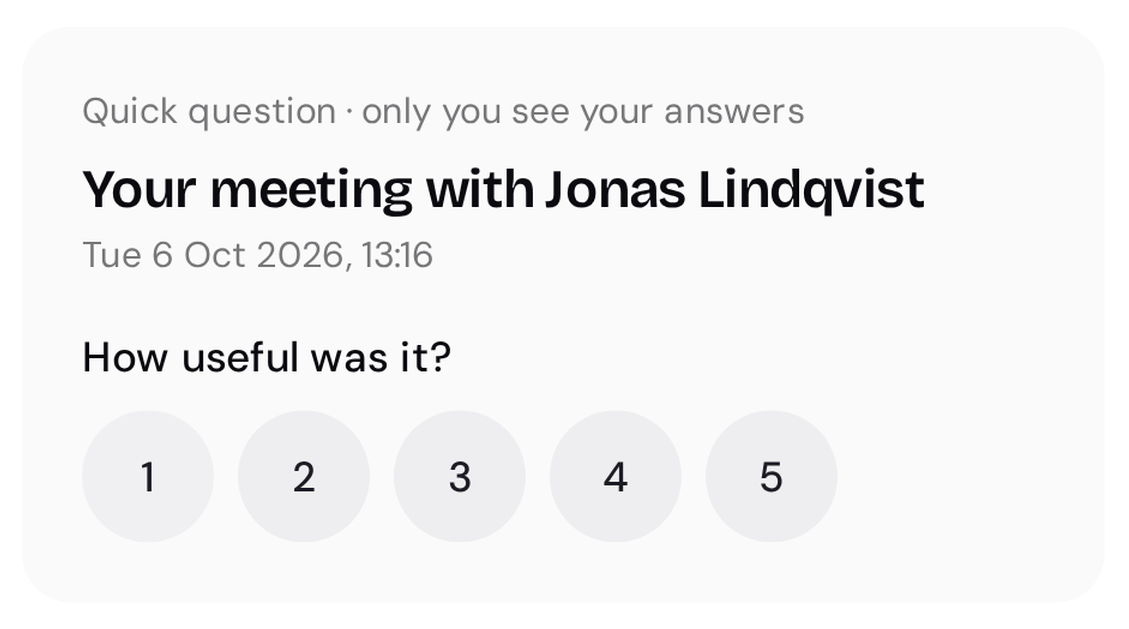
About 15 minutes after a meeting, both people answer: did it happen, how useful was it, and do they want to follow up? Meetings that happened and both rated 4 or higher count as meetings that mattered.
Ten minutes after a session, the people who attended get one tap: was it worth it?
Guests give the event a score, pick the most valuable part and say whether they would come again. Exhibitors rate lead quality and value for money, and say whether they would exhibit again. Professional and up can add two questions of their own.
At most one push every two hours and three a day. Whatever is left goes into one email the next morning, and one reminder for the survey.
MedTech Europe
Did this meeting happen?
How useful was it?
Follow up?
Feedback and survey results appear on your overview and in the report as people answer.
See how many people answered, against a target of 40% for meeting feedback and 25% for the survey.
Each exhibiting company counts once, by the answer of the person who runs the stand. Where colleagues disagree, you see that too.
Nobody sees another person’s rating. Exhibitors see totals for their own stand, and any number based on fewer than 5 people stays hidden.
MedTech Europe 2026Overview8.1 event score
72% would come again
1:1 meetings most valuable
4.2 lead quality
3.9 value for money
78% would exhibit again
612 meetings that mattered · average usefulness 4.1 · 6% no-shows
Illustrative product example
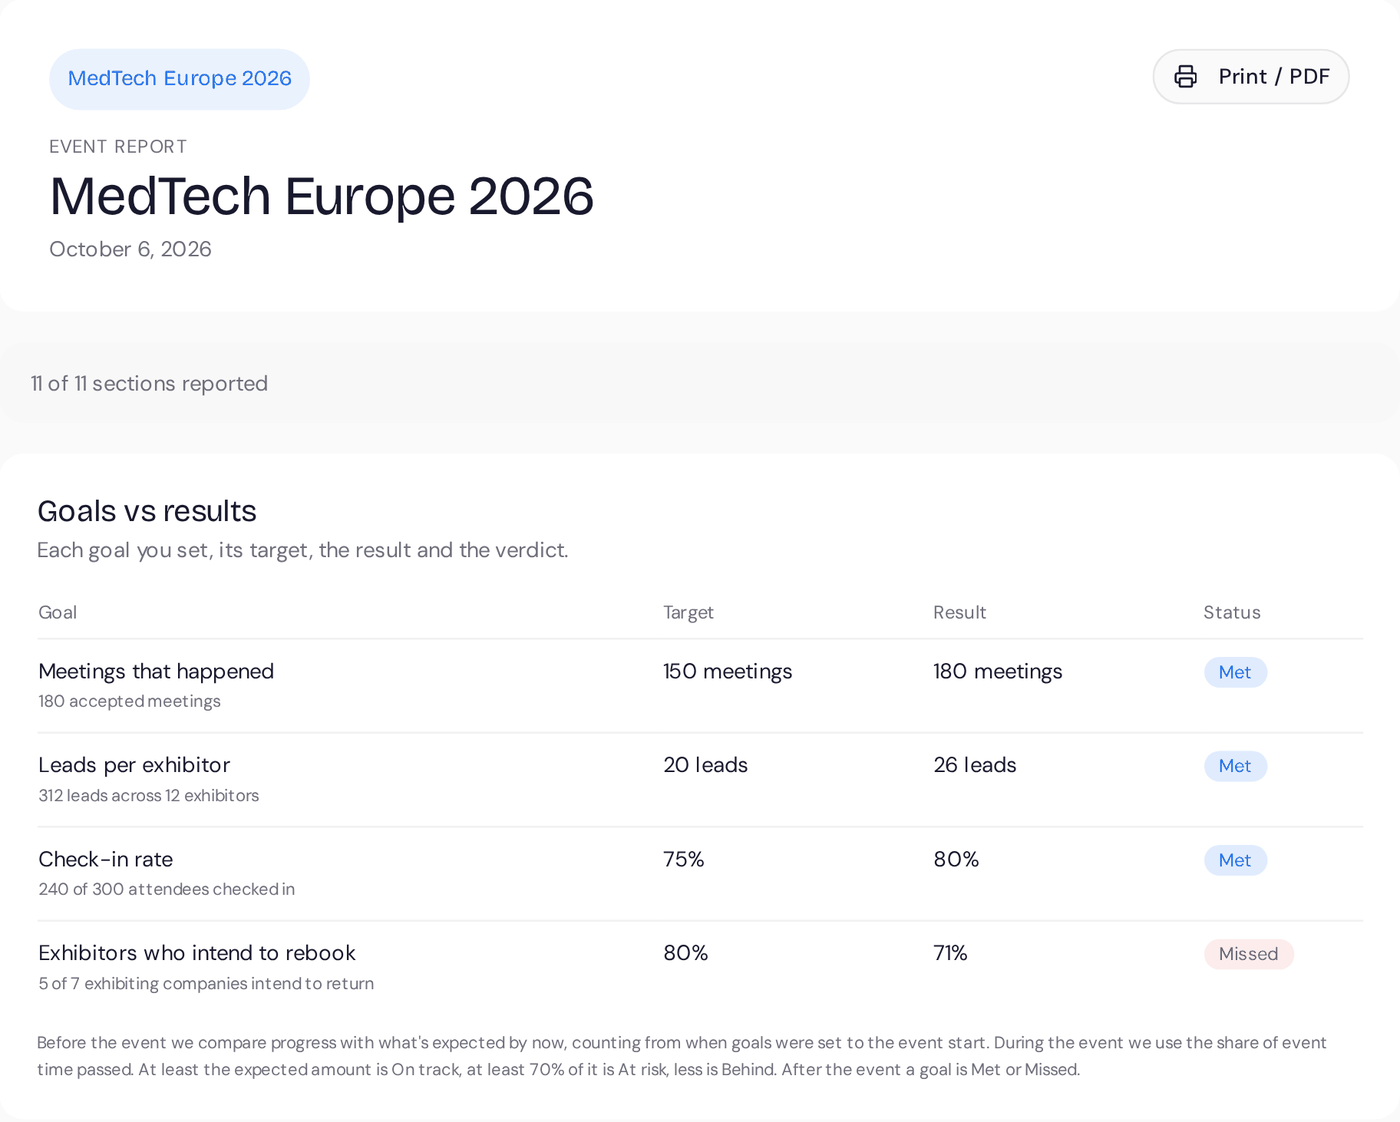
The event report puts the goals you agreed before the event next to what happened, with the evidence underneath.
Each goal shows its target, its result and its status, backed by meetings that mattered, the no-show rate, session scores, the event score and rebook intent.
See what guests asked for that the event couldn’t offer enough of, such as distributors or regulatory advice.
The Copilot can draft what went well, what to change and three priorities for next time. You see a preview first and edit it in the report.
Export the report to PDF. The goals-vs-results report comes with Professional and Signature. Running Essential? Ask us about adding it.
Event reportExample dataIllustrative product example
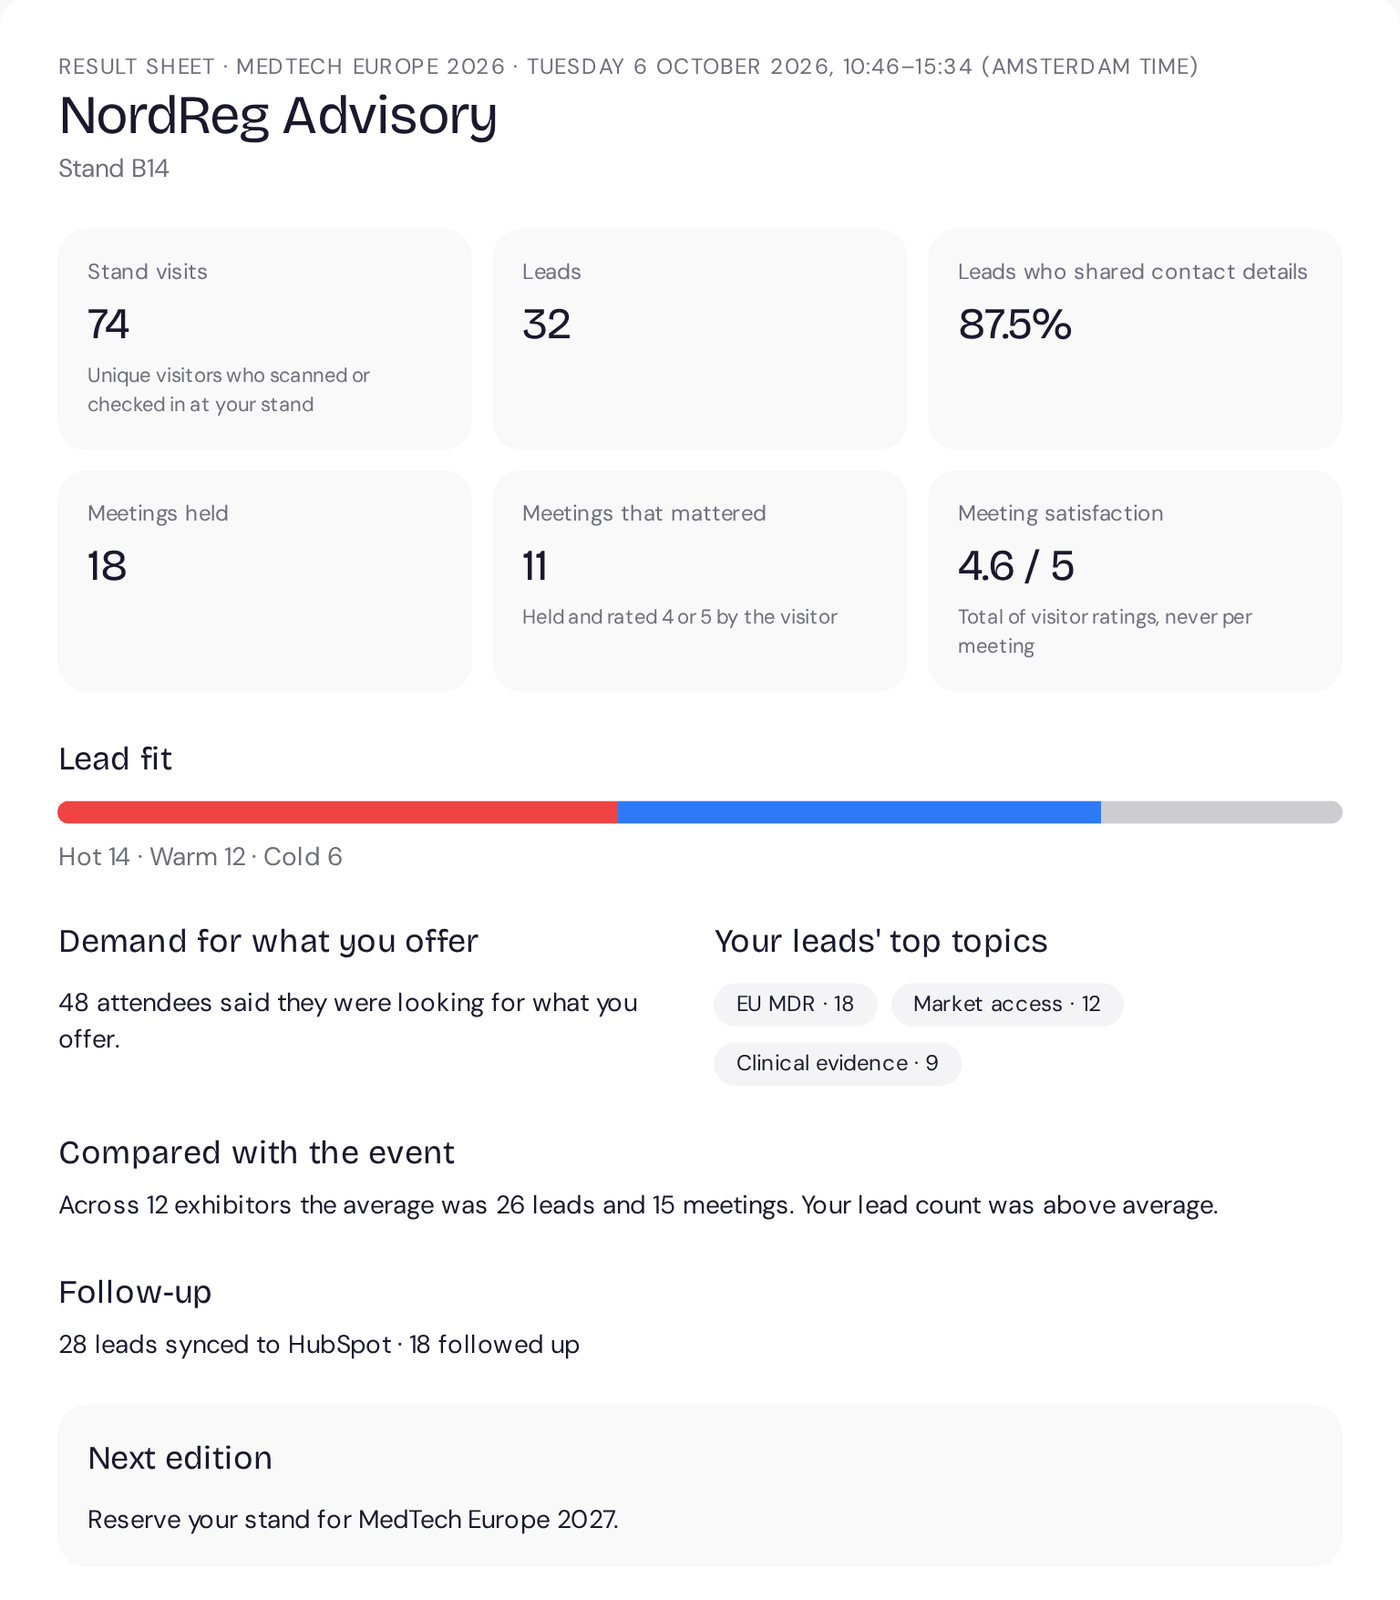
The day after the event, every exhibitor’s sheet is ready. You preview each one, add a personal note and send it to all exhibitors or a selection. Nothing goes out automatically.
Stand visits, leads and how well they fit, meetings held and meetings that mattered, their total meeting score and what their leads asked about.
An anonymous comparison with the event average, shown when at least 5 exhibitors take part.
A private link that opens without logging in, plus a PDF. You can switch the link off at any time.
Add your rebooking note or link, so the conversation about next year starts with their results.
Results sheet · NordReg AdvisoryStand B14Illustrative product example
Registration is a conversation

Looking for
Offers
Marieke needs a Nordic distributor
Jonas distributes across Scandinavia
Why you should meet
You need a Nordic distributor. Jonas distributes diagnostics to hospitals across Scandinavia and is looking for new suppliers.
Request meetingMarieke de Ruiter, Jonas LindqvistDay 1 · MedTech Europe
14:20
Shake-onnowRecommended stand
They take medical devices through Nordic registration. That matches your Q1 launch.
Show me the way Rasmus · NordReg Advisory
MedTech Europe 2026
Follow-up draft AI
MedTech Europe 2026 · ResultsMeetings per hour
Where demand beat supply
Invite more distributors next edition.
MedTech Europe 2026 · Exhibitor performanceShake-on · Your event recapShake-on · reading event dataWorking…Sent reminders to 184 registrants who haven't confirmed.
Working…Offered 13:15 meeting slots to 138 guests with open matches.
Working…Send a follow-up to 57 no-shows.